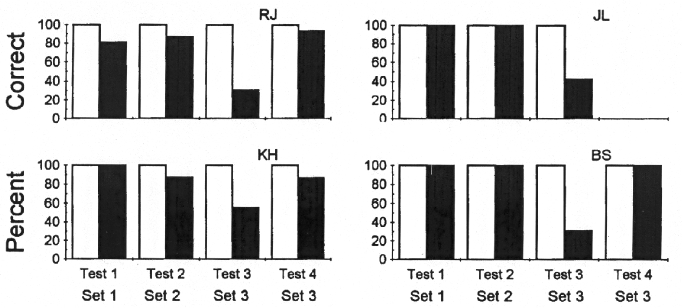
Fig. 4.

Generalization data for Experiment 2, Tests 1 to 4. The open bars indicate the percentages of correct selections on training set trials. The filled bars describe performance with Transfer Sets 1, 2, and 3. Generalization Test 1 was conducted with Stimulus Set 1; Generalization Test 2 was conducted with Stimulus Set 2 and Generalization Test 3 with Set 3. Test 4 retests with Set 3.
