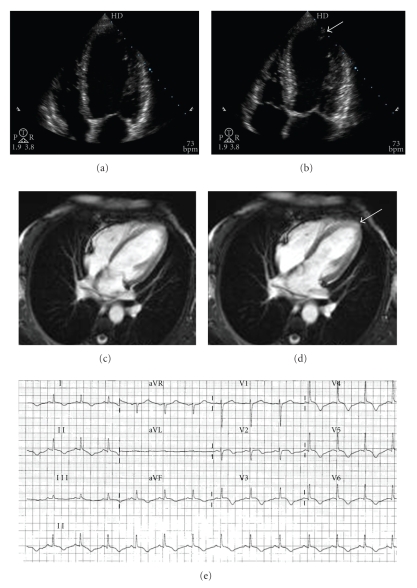
Figure 2.
(a) Regional wall-motion abnormality confirmed by transthoracic echocardiography during diastole; (b) systole (arrow); (c) magnetic resonance imaging showing wall motion abnormalities during diastole; (d) systole (arrow); (e) twelve-lead ECG demonstrating resolution of ST-segment elevation, development of T-wave inversion, and prolongation of the QT interval.

