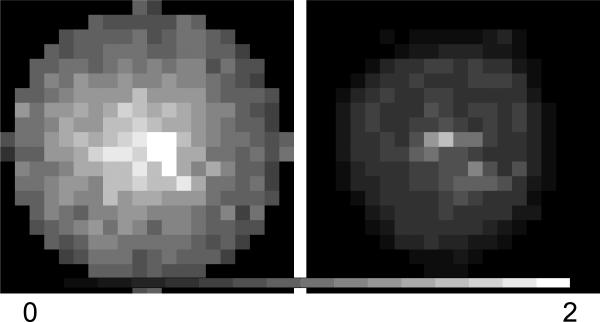
Fig. 7.
The average total photons per sub-aperture for two subjects. On the left, Subject 13, when the AO System performed well, and on the right Subject 17 for whom the AO system did not perform well. There is variation in the total photons between subjects and even across the aperture for individuals that must be considered when assessing measurement error. The colorbar range is from 0 to 2 × 10⁷.

