
Figure 2. FOXP3 Suppresses the Activation-Induced Expression of NFAT2 in T cells.
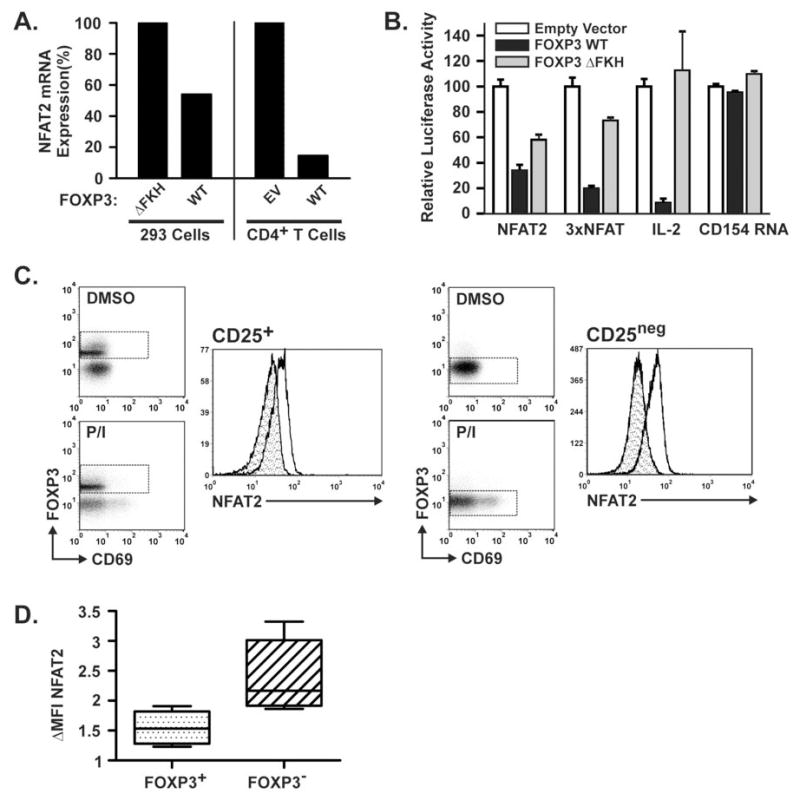
A) Quantitative real-time RT-PCR demonstrating NFAT2 mRNA expression. Left panel: 293 cell lines induced to express wild-type or mutant (▵FKH) FOXP3 for 24 hours. Right panel: Primary human CD4+ T cells transfected with an expression vector encoding WT FOXP3 or empty vector control then activated for 5 hours with PMA/Ionomycin. In each case, the control is normalized to 100%. B) Luciferase assays demonstrating the effect of WT and ▵FKH FOXP3 on transcription from the NFAT2 gene P1 promoter in primary human CD4+ T cells. The 3×NFAT and IL-2 promoter plasmids serve as positive controls and the CD154 mRNA reporter plasmid as a negative control. For each construct results are shown relative to the empty vector control which is normalized to 100%. C) Flow cytometry demonstrating decreased upregulation of NFAT2 protein in freshly isolated human CD25+FOXP3+ TREG cells vs. CD25negFOXP3neg effector T cells. CD4+ T cells isolated by negative selection were separated into CD25+ and CD25neg populations by positive selection for CD25. Diluent only (DMSO = shaded histogram) or PMA/Ionomycin treated cells (clear histogram) were then evaluated by flow cytometry for cell surface CD69 and intracellular FOXP3 and NFAT2 as described in materials and methods. Dashed boxes indicate the cell gate used to generate the NFAT2 histograms. D) Graph demonstrating the fold ΔMFI(MFIP/I/MFIDMSO) in primary CD25+FOXP3+ TREG cells vs. CD25negFOXP3neg T cells. All results are representative of 3 or more independent experiments.