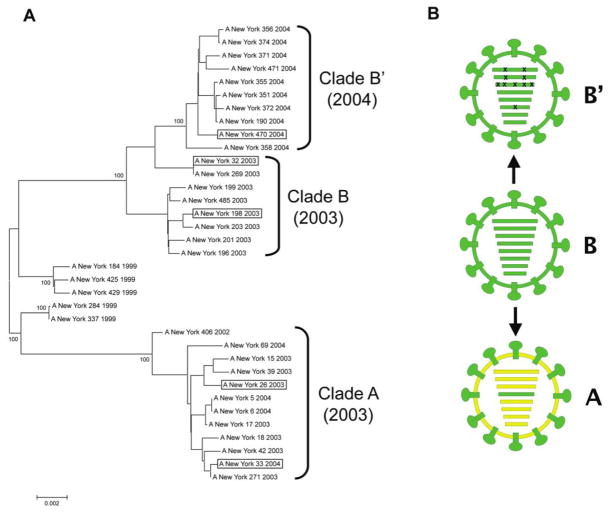
Figure 1.
Genomic analyses of Fujian-like H3N2 viruses. A, Evolutionary relationships of concatenated major coding regions of influenza A viruses sampled in New York State during the period 1999–2004. The complete genomes of 35 human H3N2 influenza A virus isolates were downloaded from the National Center for Biotechnology Information Influenza Virus Resource [15]. The major open reading frames of 6 of the gene segments (excluding HA and NA) were concatenated as a 9639 base sequence. Sequences were aligned using the neighbor-joining algorithm of Molecular Evolutionary Genetics Analysis software, version 3.1 [31], and were bootstrapped 1000 times. Bootstrap values for key nodes are shown. Boxed viruses indicate the members of each clade selected as representative in this study. B, Diagrammatic representations of the 3 genome constellations of Fujian-like and California-like H3N2 viruses are shown. Gene segments shown in RNA segment order: PB2, PB1, PA, HA, NA, NP, M, NS. The clade A virus (yellow) is shown as a reassortant containing the HA gene segment (green) and HA surface protein derived from clade B viruses, as described elsewhere [10]. The 10 coding mutations contained in the 4 gene segments constituting the viral RNP of the clade B′ viruses are indicated by Xs over the PB2, PB1, PA, and NP segments. (See supplementary figure 3 of Rambaut et al [13] for phylogenetic trees of each gene segment).

