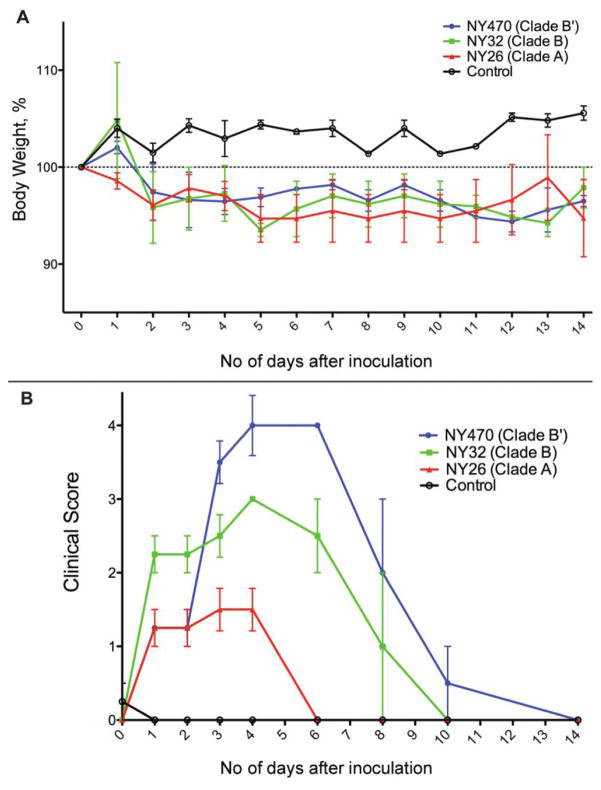
Figure 4.
Clinical course of infection in ferrets. A, Mean percentage weight loss from mean baseline weight of ferrets in each group for 0–14 days after virus inoculation. All 12 inoculated ferrets lost weight during the experiment (4 ferrets were in each virus inoculated group), whereas the 4 ferrets in the control group gained weight. Error bars represent standard error of the mean (SEM). B, Mean clinical score of ferrets in each group for 0–14 days after inoculation. Ferrets were given 1 point for each of 5 clinical illness parameters. The NY470 (clade B′)–inoculated ferrets had statistically significantly higher clinical scores than did ferrets inoculated with either the NY32 (clade B) or NY26 (clade A) viruses. Error bars represent SEM.

