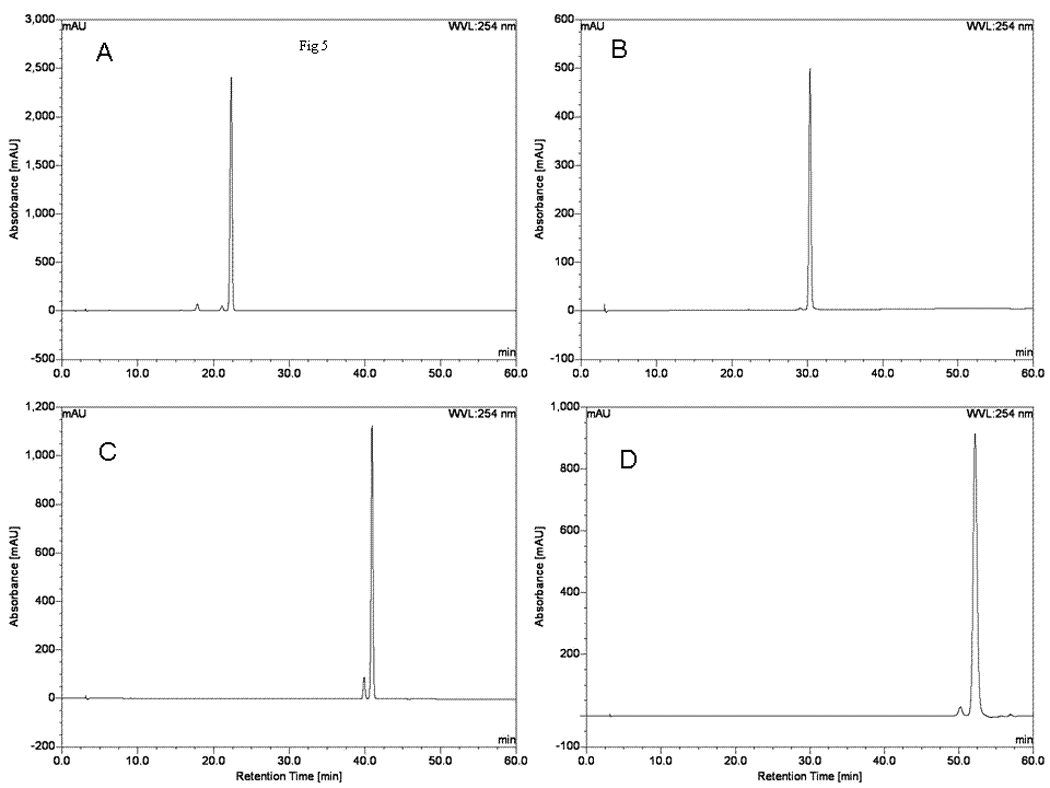
Figure 5.

HPLC analysis of four compounds separated from the crude sample II. Separation column: a C18 column (4.6 mm I.D. × 250 mm, 5 µm); column temperature: 35°C; detection wavelength: 254 nm; the mobile phase: a linear gradient of methanol (A) and 0.2% formic acid (B) that follows: A–B (30:70, v/v) to A–B (70:30, v/v) in 60 min; the flow rate: 1.0 mL min−1. (A) compound 1 in Figure 4B, (B) compound 2 in Figure 4B, (C) compound 3 in Figure 4A, (D) compound 4 in Figure 4A.
