Figure 1.
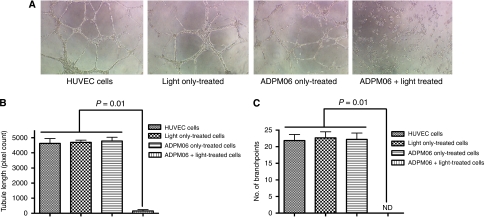
In vitro endothelial cell tubule formation assay. (A) The HUVECs, post-treatment with ADMP06-mediated PDT, were seeded in Matrigel-coated plates and photographed 7 h post-seeding. Images shown for PDT treatment (150 nM ADPM06+16 J cm−2 light) compared with cells alone, light alone, and drug alone controls. Experiment was carried out in triplicate, with representative images shown. Image analysis determined the total tubule length (B), and the number of branch-points per junction (C) in each sample. The Mann–Whitney U-test was used to compare control and treated samples. (ND, non-determinable).

