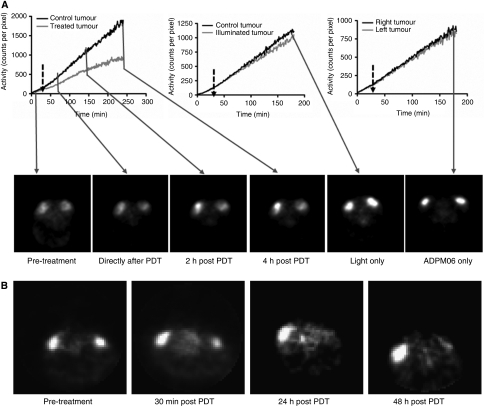
Figure 4.
The PET approach to assessing vascular-targeting effect in vivo. (A) Time-activity curves during 18FDG infusion representing dynamic radiotracer uptake in intradermal implanted 13762 MAT B III tumours in PDT (0.8 mg kg−1 ADPM06+150 J cm−2 light), light alone (150 J cm−2), and ADMP06 alone (0.8 mg kg−1) treated animals. The delay between ADPM06 injection and illumination commencement was <5 min. 18F-FDG PET image slices through tumours taken at selected time points before and after treatment are also shown. (B) The PET image slices of tumours after bolus injection of 1–1.3 mCi 18FDG and 30 min uptake at selected time points before and after ADPM06-mediated PDT, illustrating the change in tumour metabolic activity. White arrows, control tumour; grey arrows, treated tumours.

