Figure 2.
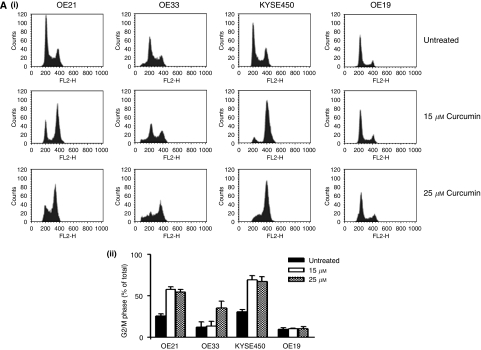
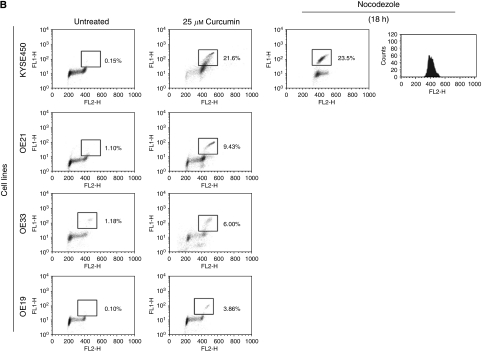
(A) (i) Assessment of DNA content in oesophageal cancer cell lines after 24 h of treatment with curcumin. DNA content analysis was carried out by propidium iodide staining and flow cytometry after 24 h of treatment with increasing concentrations of curcumin. A total of 10 000 cells were counted for each cell line and concentration. Images correspond to typical histogram distributions for each cell line at 0, 15, 25 μM of curcumin. The percentage of cells in the G2/M phase of the cell cycle was estimated using CellQuest software. (ii) The percentage of cells arrested in G2/M phase of the cell cycle. Columns are means of three experiments. Bars=s.d. (B) MPM-2 (anti-phospho-Ser/Thr-Pro) expression in untreated and treated oesophageal cancer cells. MPM-2 is an antibody that recognises a group of proteins that are phosphorylated only in mitosis. Cells were dually stained with propidium iodide to analyse DNA content, and expression was quantified by flow cytometry. As a positive control, KYSE450 cells were treated for 18 h with nocodazole, an anti-fungal agent known to induce metaphase arrest. Cell-cycle analysis and quantification of MPM-2 expression (gated cells) were carried out by flow cytometry after treatment with 25 μM of curcumin for 24 h.


