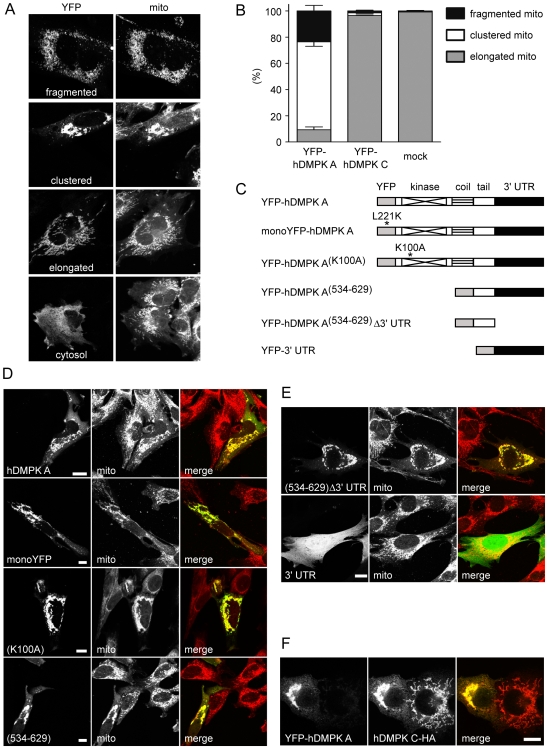
Figure 1. Perinuclear clustering of mitochondria is induced by the C-terminal domain of hDMPK A.
(A,B) C2C12 myoblasts transiently expressing YFP-hDMPK A or C fusion proteins or mock-transfected cells were stained with a cytochrome c oxidase antibody to visualize mitochondria. Typical examples of classes of mitochondrial morphology are shown in (A). Mitochondrial distribution was classified as fragmented, clustered or elongated. Frequencies of appearance are listed as percentage of the total number of cells expressing MOM-associated hDMPK A (n = 3, ∼50 cells analyzed per experiment). Around 40% of YFP-hDMPK A-expressing cells showed a cytosolic expression. These cells contained mitochondria with a typically elongated shape, but were disregarded in the analysis. (C) Schematic representation of YFP constructs used for transfection expression with protein domains, mutations and 3′ UTR indicated. (D) C2C12 myoblasts expressing YFP fusion proteins were stained with a cytochrome c oxidase antibody to visualize their ability to induce clustering of mitochondria. (E) Expression of constructs with altered 3′ UTRs demonstrated that the hDMPK A 3′ UTR was not involved in mitochondrial clustering. (F) Co-expression of YFP-hDMPK A and hDMPK C-HA in N2A cells resulted in mitochondrial clustering, whereas cells only expressing hDMPK C-HA exhibited normal, elongated mitochondria. Bars, 10 µm.

