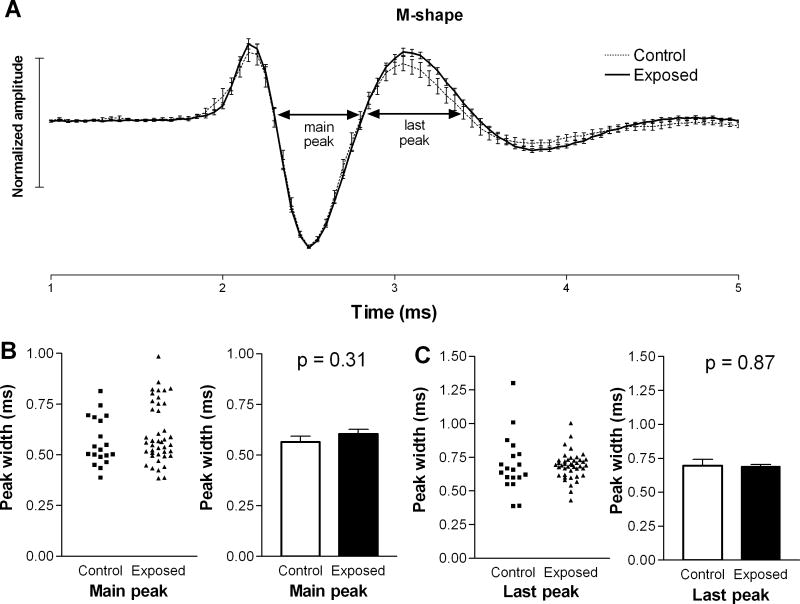
Figure 2.
Comparison of M-shaped spike waveforms in the DCNs of exposed and control animals. The mean spike waveform (± S.E.), normalized by dividing all amplitude values by the absolute values of the maximum peaks, of M-shaped spikes in exposed animals were not found to be significantly different from those in controls. Although there was a small increase in the average amplitude of the last peak following sound exposure (A), this increase was not statistically significant. The durations of individual peaks in the M-shaped spike waveforms were also not statistically different in control and exposed animals (B, C).

