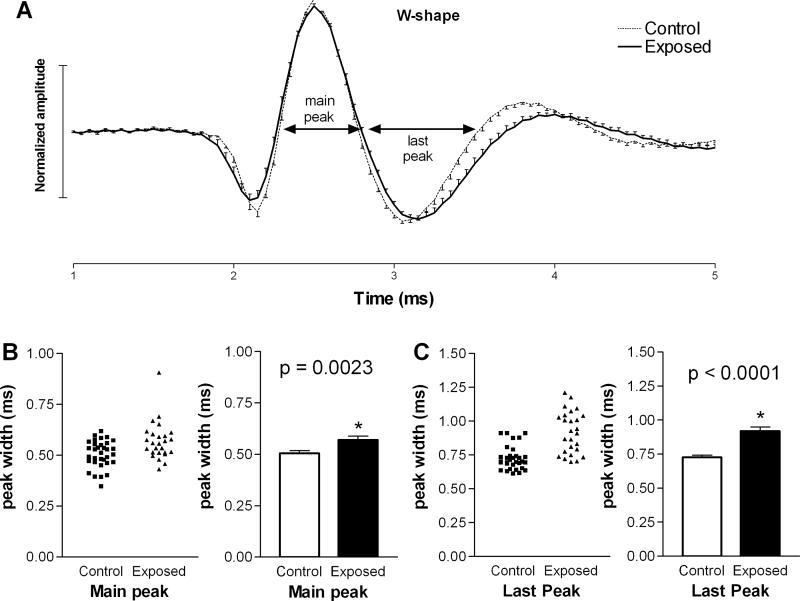
Figure 3.
Examination of W-shaped spike waveforms in exposed and control animals. Panel A compares the mean waveforms from the two groups, normalized as in Fig. 2. Note that the durations of the main and last major peaks in the waveform (B, C) were significantly increased in units from exposed animals compared to those from controls.

