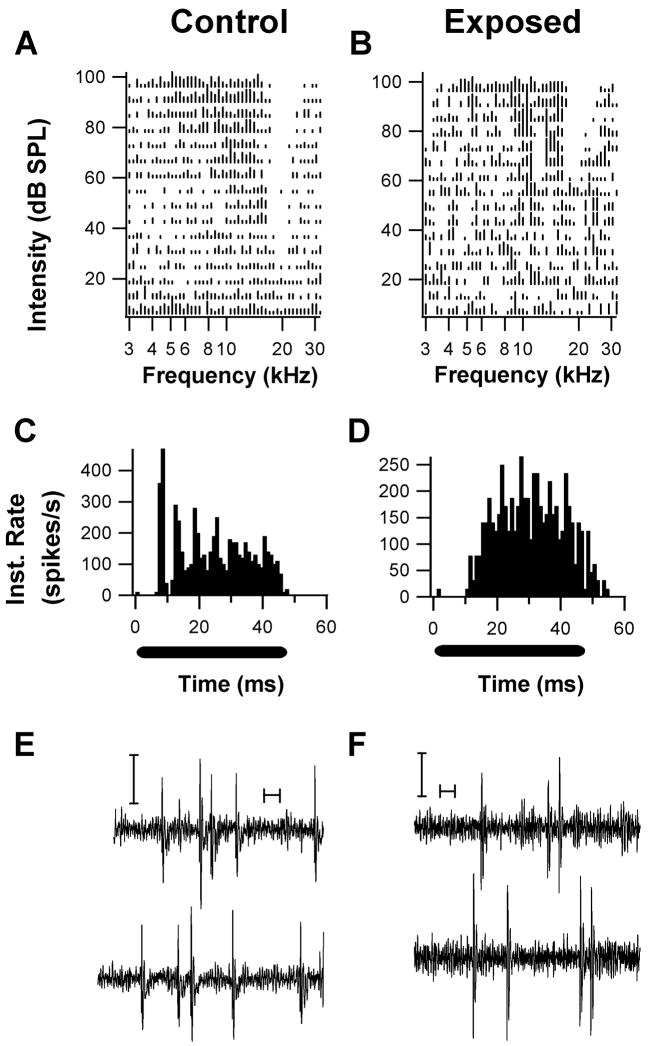
Figure 8.
Examples of units with type III spectral response patterns and their associated temporal response patterns. (A. Unit from a control animal; B, Unit from an exposed animal). The response areas both show a V-shaped excitatory area with a lateral inhibitory side band in which spontaneous activity was inhibited. One unit exhibited a chopper response pattern (C) and W-shaped spikes (E), while the other unit exhibited a buildup pattern (D) and W-shaped spikes. Both PST patterns were obtained in response to a CF tone burst 20 –30 dB above threshold. (Y-axis represents Instantaneous rate; black bars under PSTHs indicate tonal stimulus period). These response patterns are typical of DCN fusiform cells. Both units exhibited couplet (pairs of spikes with interspike intervals of less than 10 ms) firing activity during recordings of spontaneous activity (E, F, calibration bars are 10 ms, and 50 μV).

