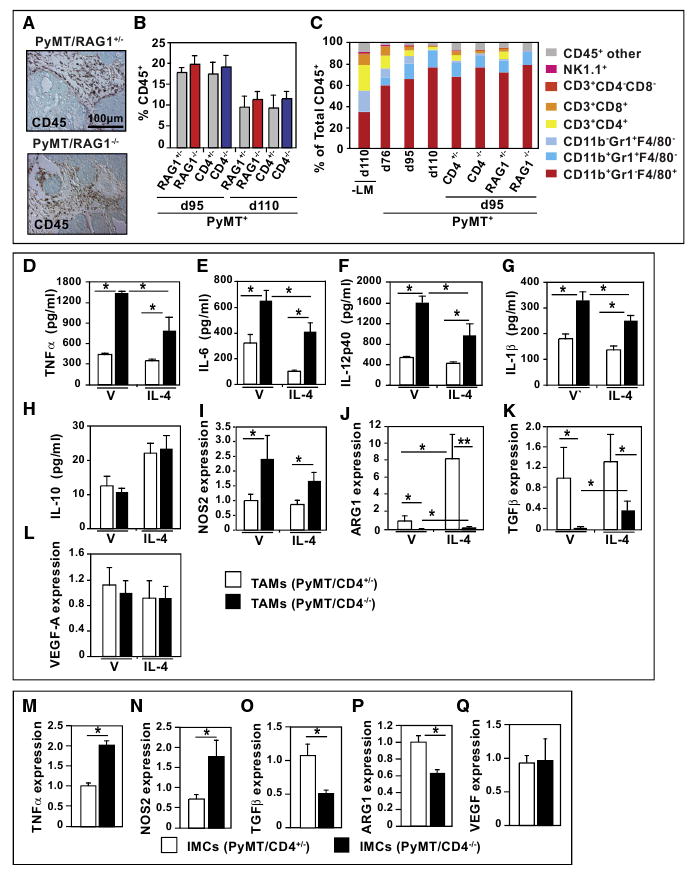
Figure 3. CD4+ T Lymphocytes Do Not Regulate Leukocyte Infiltration but Instead Regulate Bioeffector Function of Myeloid Cell Subsets.

(A) Immunodetection of CD45+ cells in 95-day-old PyMT/RAG1+/− and PyMT/RAG1−/− mammary carcinomas. Representative 20× images are shown.
(B) Flow cytometric analysis of CD45+ cells in tumors from 95 and 110-day-old PyMT/RAG1 and PyMT/CD4 mice. Data are depicted as the mean percent of live cells ± SEM, n = 4 mice per cohort.
(C) Flow cytometric analysis of individual leukocyte populations as a percent of total CD45+ cells in mammary carcinomas of PyMT mice during progression and in day 95 tumors from RAG1-and CD4-deficient/PyMT mice. Data are depicted as the mean value from four mice/cohort ± SEM. No statistical differences were found between groups by Mann-Whitney test.
(D–L) Cytokine expression by TAM. Tumor-associated CD45+F4/80+Gr1− macrophages were isolated by dual magnetic and flow sorting of mammary tumors from 95 day-old PyMT/CD4+/− and PyMT/CD4−/− mice (n = 3/cohort). Cytokine expression (TNF-α, IL-6, IL-12p40, IL-1β, IL-10) was assessed by ELISA of conditioned medium or by quantitative reverse transcriptase-polymerase chain reaction (qRT-PCR; Nos2, Arg1, Tgfβ and Vegf-a) from TAMs (50,000) following 18 hr of culture with or without exogenous recombinant IL-4 (10 ng/ml). Representative assays of mammary carcinomas from three or four mice evaluated independently in triplicate and depicted as mean ± SEM.
(M–Q) Analysis of tumor-derived IMC phenotype in PyMT/CD4−/− mice. Tumor-associated CD45+ CD11b+Gr1Hi IMCs were isolated by flow from mammary tumors of 95-day-old PyMT+/CD4+/− and PyMT/CD4−/− mice (n = 3/cohort). Isolated cells were lysed and RNAs assessed by qRT-PCR as described above. Representative assays from two independent cohorts each run at least in triplicate are depicted as mean values ± SEM. Asterisk denotes p < 0.05 by Mann-Whitney in all panels.
