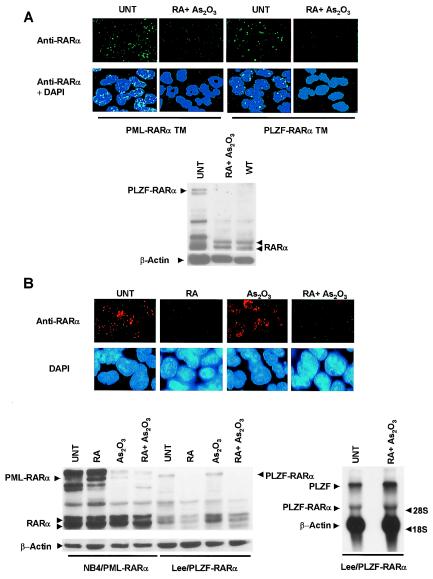
Figure 5.
In vivo and in vitro effects of RA or RA + As2O3 treatments on the PML-RARα and PLZF-RARα oncoproteins. (A Upper) Indirect immunofluorescence with an anti-RARα polyclonal antibody on BM cells from leukemic PML-RARα and PLZF-RARα TM-treated for 7 days with As2O3 + RA at the same doses used for the trials. In the PLZF-RARα TM, the WBC counts at leukemia presentation were 80,000 cells per μl (4,000 blasts per μl) and a week later 320,000 cells per μl (9,600 blasts per μl) demonstrating the resistance to treatment of this leukemia. The PML-RARα TM, on the contrary, responded well to As2O3 + RA treatment. WBC counts at leukemia presentation 38,500 cells per μl (1,925 blasts per μl) and a week later 16,200 cells per μl with no blasts detected in the PB. The green dots reveal the microspeckled distribution of the fusion proteins. Staining with 4′,6-diamidino-2-phenylindole was performed to reveal nuclei. (×1,000.) (A Lower) Cellular extracts from BM cells from the leukemic PLZF-RARα TM shown in A were subjected to Western blot analysis with an anti-RARα antibody (see Materials and Methods). Arrowheads indicate the PLZF-RARα, RARα, and β-actin proteins. (B Upper) Immunofluorescence analysis with an anti-RARα antibody on Lee cells treated for 24 h with RA (10−7 M), As2O3 (10−6 M), or As2O3 + RA at the same doses, or untreated (vehicle). (×1000.) (B Lower Left) Western blot analysis of protein extracts from NB4 and Lee cells treated as in B Upper. Arrowheads indicate the PML-RARα, PLZF-RARα, and RARα and β-actin proteins. (B Lower Right) Northern blot analysis of total RNA extracted from Lee cells treated with RA (10−7 M) plus As2O3 (10−6 M) for 3 h or untreated (vehicle). Arrowheads indicate the PLZF, PLZF-RARα, and β-actin RNA.

