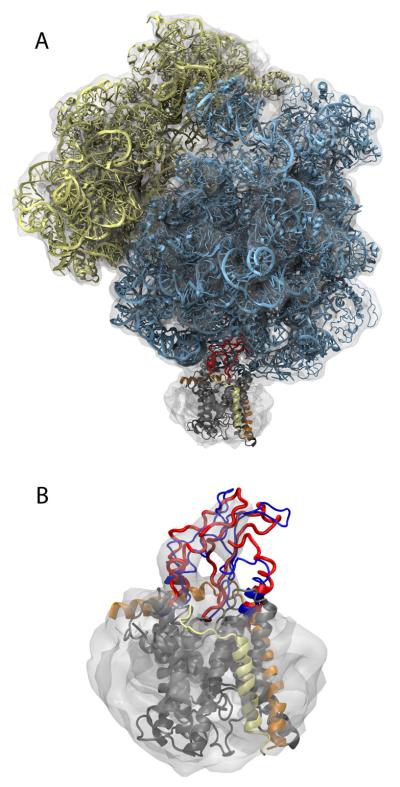
Figure 2.
Molecular dynamics flexible fitting of the ribosome-translocon complex. (A) Fitted structure. The ribosome and SecYEβ are colored as in Figure 1 except that both loops 6/7 and 8/9 are shown in red. The cryo-EM map used for fitting is shown in grey, transparent, contoured at 1.67σ above the mean. (B) Fitting of SecYEβ. Only parts of SecY near the ribosome (e.g., loops 6/7, 8/9, and the C-terminus) were free during fitting. Blue represents the starting structure and red the final one. See Figure S1 for a stereo view and Movie S2 for an overview of the fitting procedure, both in Supplemental Data.

