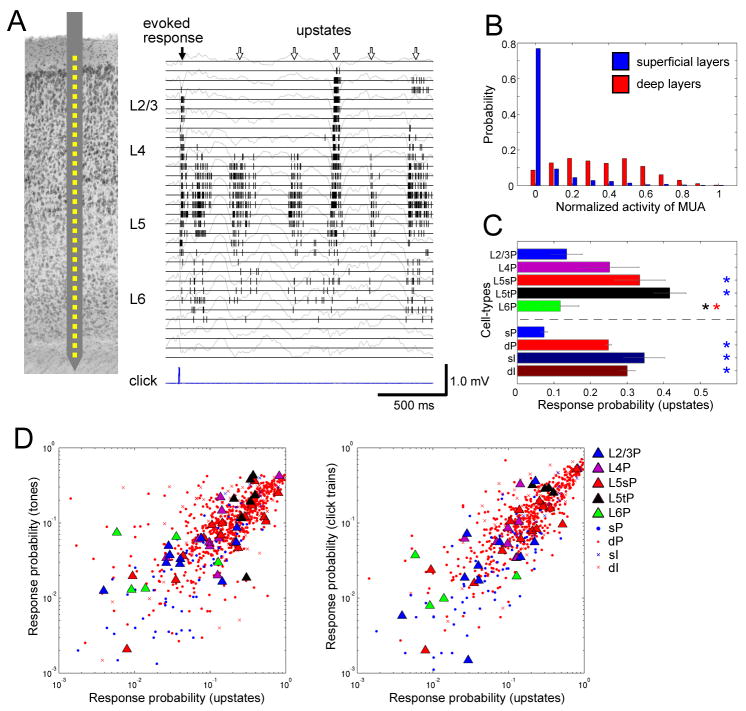
Figure 3. Sparseness varies between cell classes during spontaneous activity.
(A) Left, schematic drawing of recording by a 32-site linear electrode. Right, raster plot of multi-unit activity (MUA) for each channel, superimposed on local-field potentials (gray traces).
(B) Probability distributions of normalized MUA spike count across upstates, for superficial (putative L2/3) and deep (putative L5) layers (2082 upstates from 5 datasets). Distribution of superficial MUA differs significantly from that of deep layers (Kolmogorov-Smirnov test, p<0.0001).
(C) Response probability measure of firing sparseness for upstates, for all cell types (c.f. Figure 2A).
(D) Correlation of response probability between sensory responses and upstates (c.f. Figure 2B).

