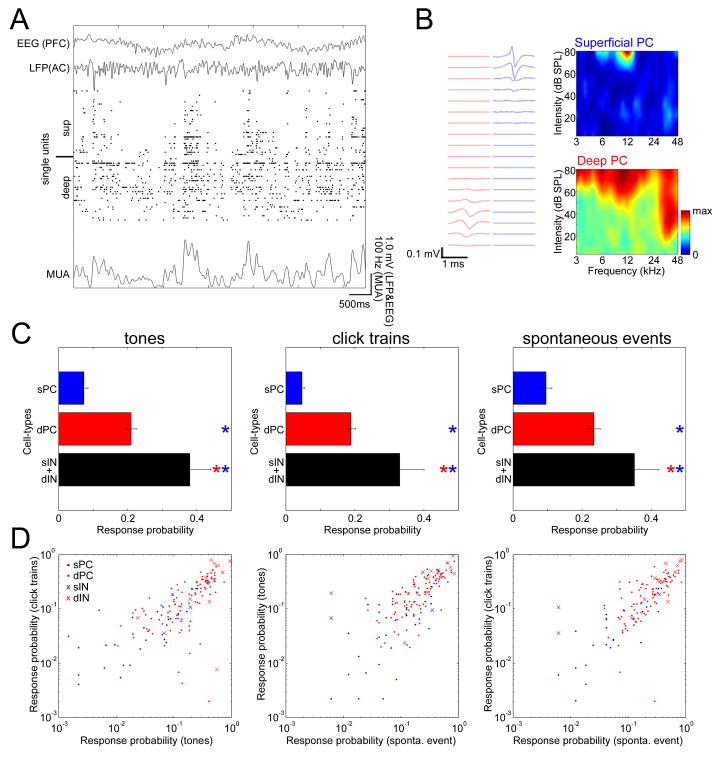
Figure 7. Cell-type dependent sparseness of spontaneous and evoked activity in unanesthetized animals.
(A) Raster of simultaneously recorded spike-sorted units showing spontaneous fluctuations of population activity in a head-restrained, unanesthetized animal. Also shown are electroencephalogram (EEG) recorded from the prefrontal cortical (PFC) area with a screw, local-field potential (LFP) recorded locally (AC, auditory cortex), and multiunit activity (MUA), calculated by summation of firing of all single units and smoothing with a 70-ms Gaussian kernel.
(B) Left, example waveform profiles of simultaneously recorded putative superficial and deep PCs. Right, spectral tuning of example cells.
(C) Response probabilities of extracellularly recorded cells for tones (left), click trains (center), and spontaneous events (right), indicating sparser activity of superficial putative PCs than those of deep putative PCs and putative INs (ANOVA with post hoc lsd test, p<0.0001 in all cases) (c.f. Figures 2A and 3C). Asterisks denote pairwise post-hoc lsd tests, indicating a significant difference (p<0.05) to the class corresponding to that color. sP, superficial PCs; dP, deep PCs; sI, superficial INs; dI, deep INs. Error bars indicate SE.
(D) Sparseness is correlated across event types (r=0.80, p<0.0001 in left; r=0.73, p<0.0001 in center; r=0.72, p<0.0001 in right). Each symbol shows the response probability of one cell to tone and click stimuli (left), tone stimuli and spontaneous events (center), and click stimuli and spontaneous events (right) (c.f. Figures 2C and 3D).

