
Figure 3.
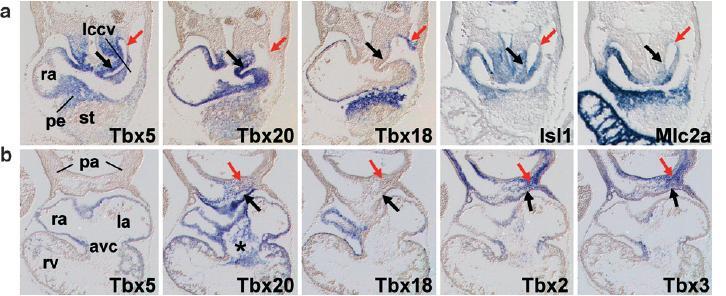
Transverse serial sections of an E9.5 mouse embryo showing the expression of T-box genes in the heart. (a) T-box expression patterns in the inflow tract/dorsal mesocardium region compared with second heart field marker Isl1 and myocardial marker Mlc2a. The black arrows depict the dorsal posterior region of the Isl1 + second heart field, which expresses Tbx5 and Tbx20. The red arrows depict the caudal heart field, which only expresses Tbx18. (b) T-box expression patterns in the outflow tract/pharyngeal region. The black arrows and red arrows depict the pericardial mesothelium and mesenchyme, respectively, of the anterior region of the second heart field, which expresses Tbx20, Tbx2 and Tbx3. Note the expression of Tbx5 and Tbx18 in the proepicardium (pe). The asterisk marks the atrioventricular cushion mesenchyme expressing Tbx20, Tbx2 and Tbx3. avc, atrioventricular canal; ep, epicardium; la, left atrium; lccv, left common cardinal vein; pe, proepicardium; pa, pharyngeal arches; ra, right atrium; rv, right ventricle; st, septum transversum.