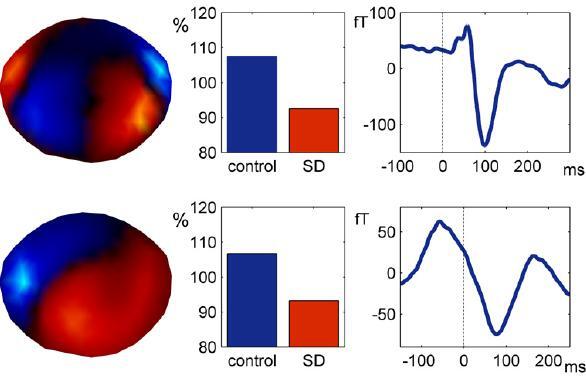
Figure 1.

Reduction of the auditory- (upper panel) and motor-related (lower panel) response after SD. Left: spatial distribution of both responses showing event-related activity above either bilateral auditory areas or the left sensorimotor area (head is viewed from above using a Mercator-mapping; nose is upwards). Middle: the strength of event-related components in the control (blue) and sleep-deprived (red) condition. Right: the corresponding event-related fields [see ref. 76, for more details].
