
Figure 5. 10 Year Survival Plot of Patient Prognostic Groups According to Their Prognostic Index Score.
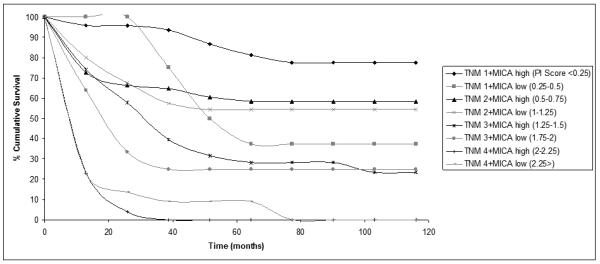
The graph shows cumulative survival for each of the prognostic groups as sub-divided according to our prognostic model generated from the Cox Regression analysis. The prognostic model was generated based on TNM category and MIC expression level. Each prognostic group is indicated in the legend with the corresponding prognostic index score.