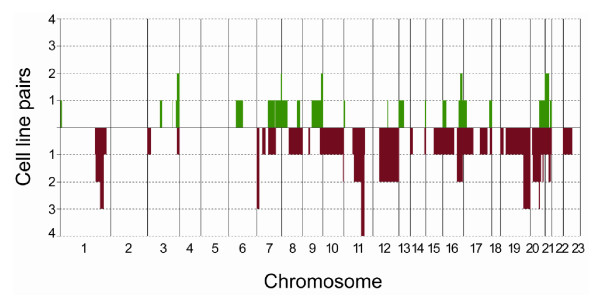
Figure 3.
Frequency plot for chromosomal alterations identified by array CGH with 1,25D resistant vs. sensitive MCF7 cell lines. Alterations are ordered by chromosomal position and the y-axis indicates the number of cell line pairs in which the given alteration occurs. Green represents gains and red losses.

