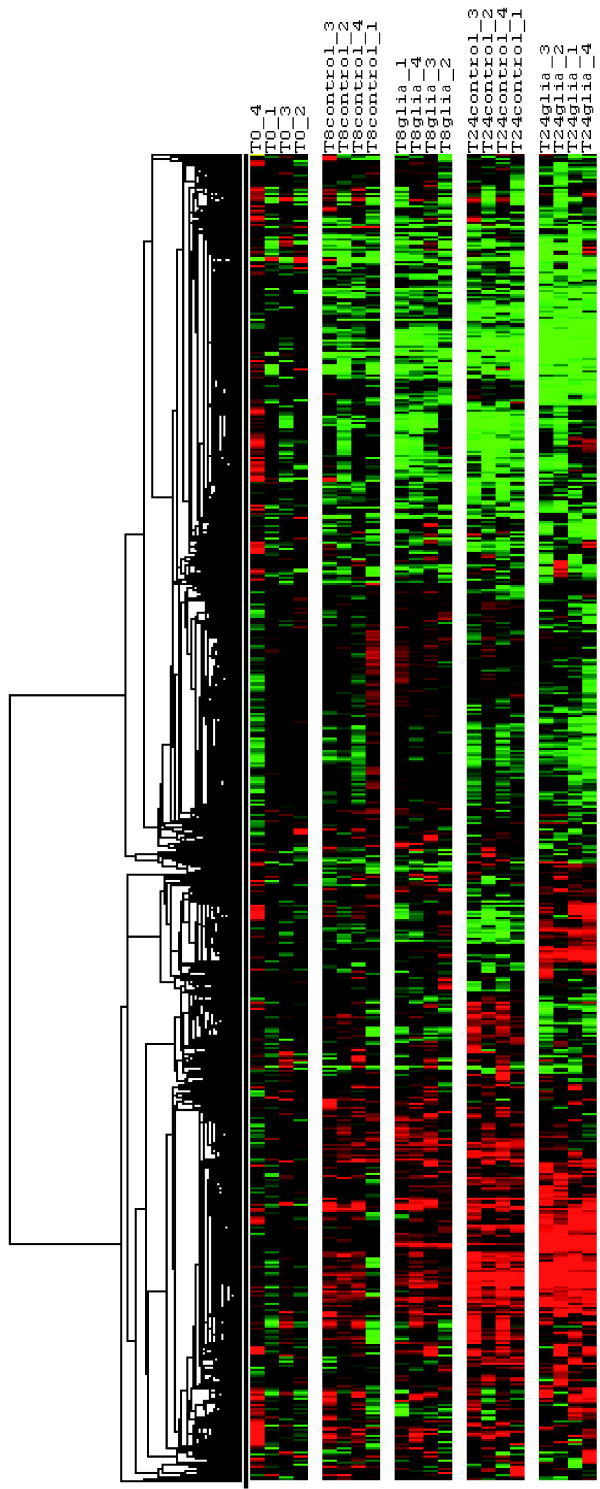
Figure 1.
Hierarchical clustering of expression data. Four individual microarrays were used per condition. Hierarchical clustering was performed on genes using Gene Cluster. Each ratio was normalized to the median of the t = 0 hour-condition values of the corresponding gene. Each column represents an individual array (T0: t = 0 hour condition samples; T8control: t = 8 hours of culture without EGC; T8glia: t = 8 hours of culture in presence of EGC; T24control: t = 24 hours of culture without EGC; T24glia: t = 24 hours of culture in presence of EGC). Each line represents one individual gene. The clustering shows the impact of the time of culture on gene expression profiling in Caco-2 cells. The EGC-induced modulation of IEC transcriptome is highly visible at t = 24 hours.

