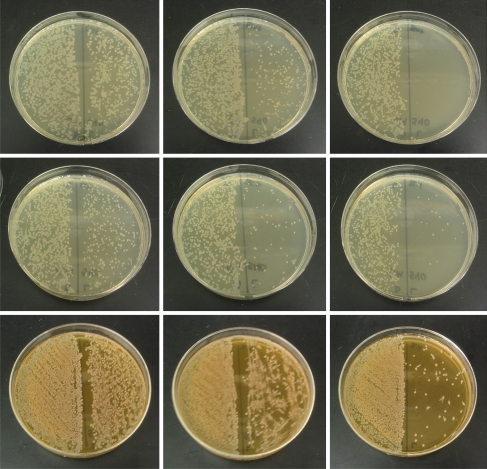
Fig. 4.
Top row: plates of P. aeruginosa after incubation with HGMB, 1a16 · HGMB, and 1a32 · HGMB (left to right); middle row: plates of P. aeruginosa after incubation with 5 μM H2O2 and: HG, 1a16 · HG, and 1a32 · HG (left to right); bottom row: plates of E. coli after incubation with 500 μM H2O2 and: HG, 1a16 · HG, and 1a32 · HG (left to right). In each case, the left half of the plate was streaked with cultures kept in the dark while cultures exposed to light were used to streak the right side to show the effect of light

