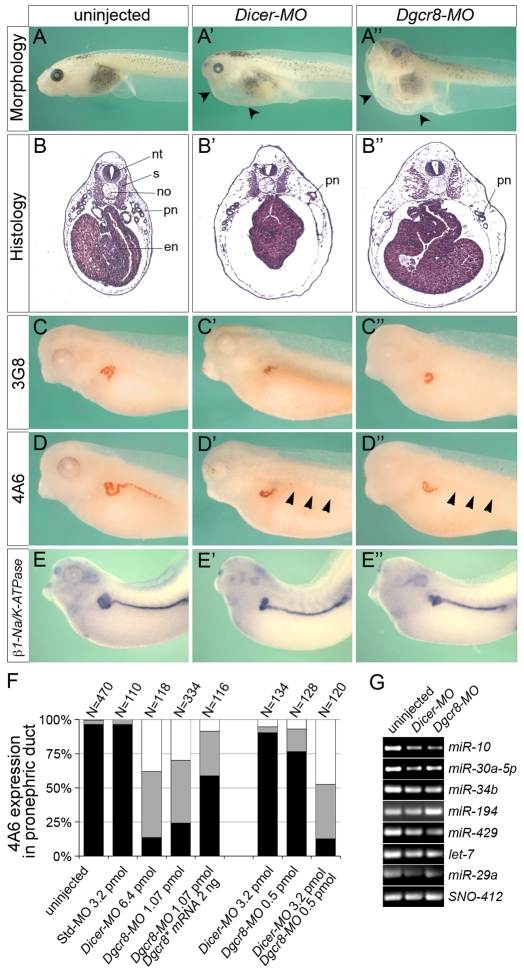
Fig. 1.
Inhibition of miRNA biogenesis results in pronephric abnormalities. (A-E″) Xenopus embryos were injected with 6.4 pmol Dicer-MO or 1.07 pmol Dgcr8-MO and compared with uninjected sibling embryos by morphology at stage 43 (A-A″), histology with Hematoxylin and Eosin at stage 42 (B-B″), immunostaining with 3G8 and 4A6 at stage 40 (C-D″), and by whole-mount in situ hybridization for β1-Na/K-ATPase at stage 39 (E-E″). Arrowheads indicate edema formation (A′,A″) and the loss of 4A6 staining in duct (D′,D″). en, endoderm; no, notochord; nt, neural tube; pn, pronephros; s, somites. (F) Quantification of 4A6 staining in the pronephric duct, comparing uninjected control embryos with embryos injected with a standard control MO (Std-MO), Dicer-MO, Dgcr8-MO, a combination of Dicer-MO and Dgcr8-MO, or Dgcr8-MO together with Dgcr8* mRNA at stage 40. The graph represents the summary of at least three independent experiments. The number (N) of embryos analyzed is indicated above the bars. Black, normal expression; gray, partial expression; white, no expression. (G) RT-PCR analysis of multiple miRNAs after Dicer and Dgcr8 knockdown at stage 35. SNO-412 served as loading control.

