Fig. 5.
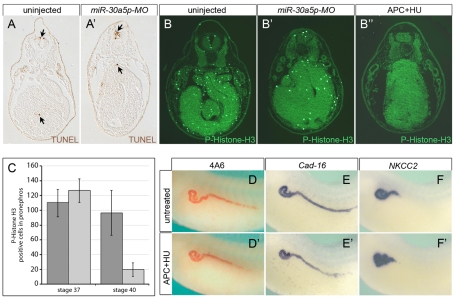
Apoptosis and proliferation do not contribute to the kidney phenotype. (A,A′) TUNEL staining of transverse sections from uninjected and miR-30a5p-MO-injected Xenopus embryos at stage 39. TUNEL-positive cells appear brown and are indicated by arrows. Note that no significant differences were observed by analyzing many serial sections of the pronephros. Several embryos and multiple independent experiments were analyzed. (B-B″) Immunofluorescence analysis of proliferation with an anti-phospho-Histone H3 antibody comparing transverse sections of uninjected control embryos, embryos injected with miR-30a5p-MO and embryos treated with aphidicolin and hydroxyurea (APC+HU) at stage 40. (C) Quantification of phospho-Histone H3-positive cells in the pronephros of uninjected (dark gray) and miR-30a5p-MO-injected (light gray) embryos at stages 37 and 40. Consecutive sections covering the entire pronephric tubular area were counted. Numbers are the average of at least four different embryos from two independent experiments. Error bars represent s.d. (D-F′) Immunostaining and in situ hybridization of untreated and APC+HU-treated embryos with 4A6 (D,D′), Cadherin-16 (Cad-16; E,E′) and NKCC2 (F,F′). Note the absence of any patterning differences, even though proliferation was completely inhibited.

