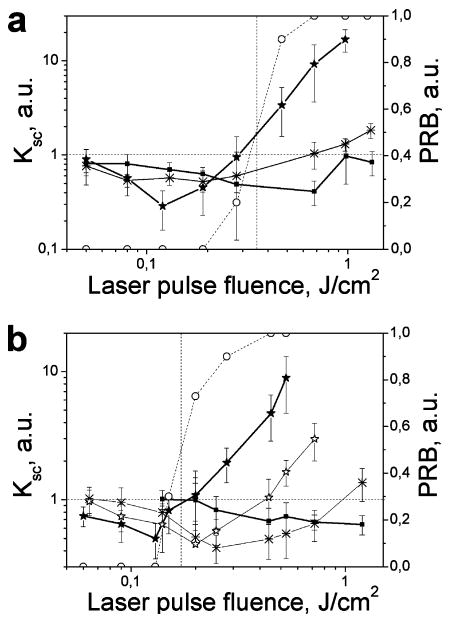
Figure 4.

Relative scattering efficacy of individual NPs ((a) for 90 NPs; (b) for 250 nm NPs), Ksc measured as a function of the pump pulse fluence at several time delays between the pump and probe pulses: solid square at 0.5 ns; snowflake at 1.5 ns; hollow star at 2.5 ns; solid star at 9 ns; hollow circle and the dotted line shows the probability PRB of the bubble generation around an NP as independently measured by the thermal lens method.
