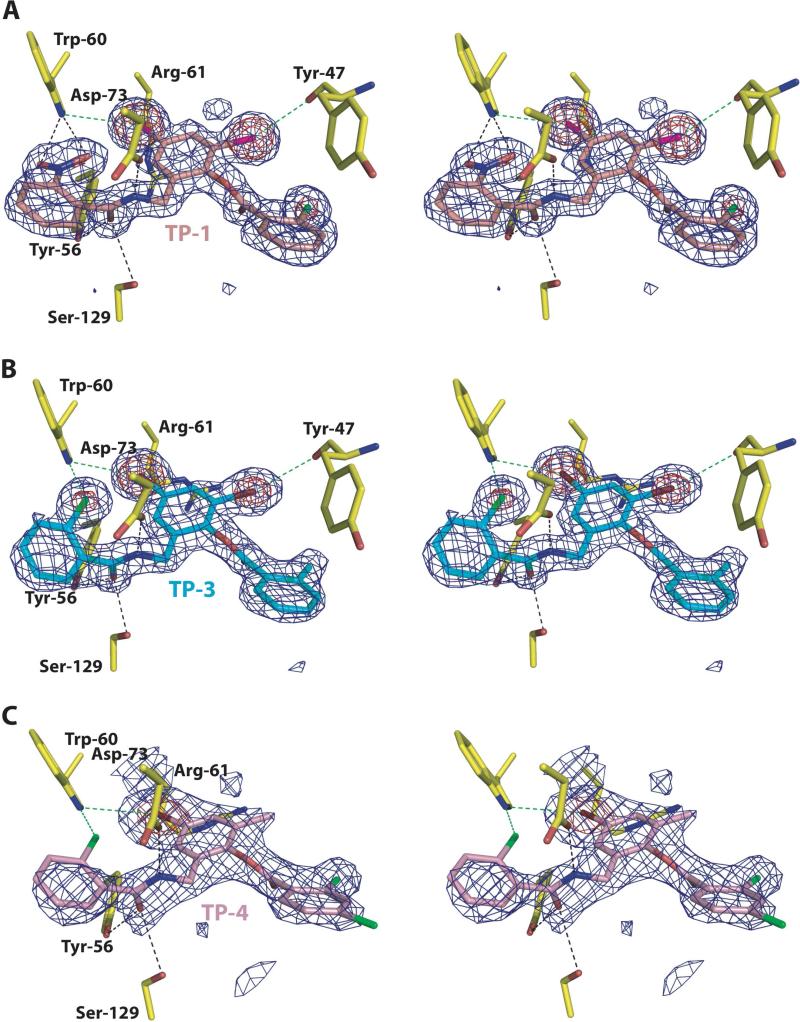
Figure 3. Close-up view of the LasR-triphenyl mimic complexes.
Stereo-view of electron density maps calculated using Fourier coefficients Fobs – Fcalc with phases derived from the final refined model of a LasR-triphenyl mimic complex minus the coordinates of the ligand prior to one round of crystallographic refinement. (A) For the Lasr-TP-1 complex, the maps are contoured at 4σ (blue mesh) and 10σ (red mesh). The final refined coordinates are superimposed with the protein residues colored in yellow and the TP-1 ligand molecule colored in purple. (B) For the LasR-TP-3 complex, the maps are contoured at 4σ (blue mesh) and 10σ (red mesh). The final refined coordinates are superimposed with the protein residues colored in yellow and the TP-3 ligand molecule colored in light blue. (C) For the Lasr-TP-1 complex, the maps are contoured at 2.8σ (blue mesh) and 8σ (red mesh). The final refined coordinates are superimposed with the protein residues colored in yellow and the TP-4 ligand molecule colored in pink. Note the electron dense features that identify the location of the halogen substituents on each of the triphenyl scaffolds. Black dashed lines indicate hydrogen bond interactions and green dashed lines indicate halogen bond interactions.

