
Figure 6. Identification of Complex I Associated Proteins through Phylogenetic Profiling.
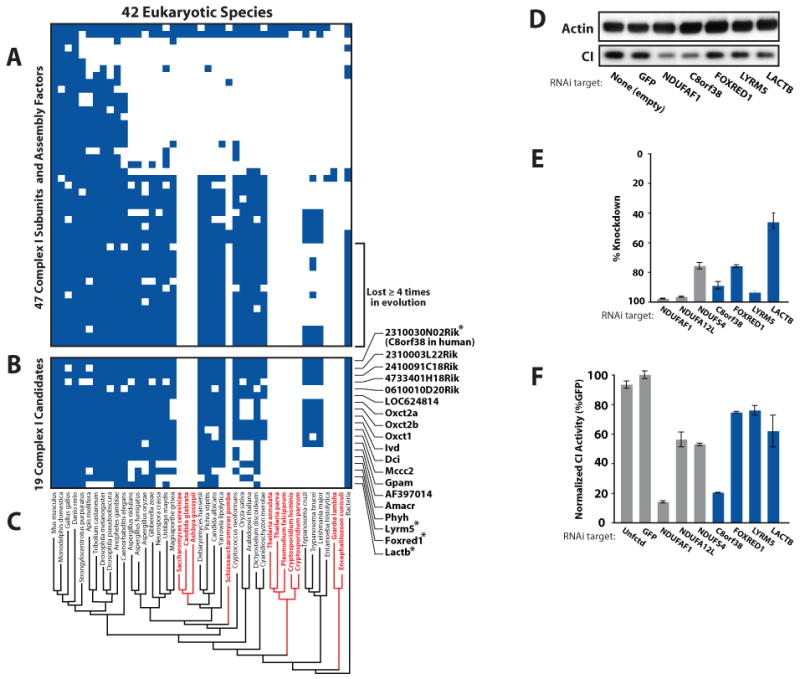
(A) Presence/absence matrix for 44 respiratory chain CI subunits and 3 assembly factors across 42 eukaryotic species. Blue squares indicate homology of the mouse protein (row) to a protein in a target species (column).
(B) MitoCarta proteins matching the phylogenetic profile of the subset of CI subunits lost independently at least four times in evolution. Asterisks indicate candidates tested by RNAi in (D-F).
(C) Reconstructed phylogenetic eukaryotic tree, with red text indicating species that have lost CI.
(D) Effect of candidate knockdown on CI levels in human fibroblasts. Immunoblots of actin and a CI subunit from whole cell lysates were performed following lentiviral-mediated delivery of an empty vector or hairpins targeted against GFP (negative control), NDUFAF1 (known CI assembly factor) and four CI candidates.
(E) Percent knockdown of mRNA expression achieved for controls (gray bars) or CI candidates (blue bars) as measured by real-time qPCR.
(F) CI activity assays from fibroblast lysates (as in D) for controls (gray bars) and four candidates (blue bars). Error bars represent the range of duplicate assays.