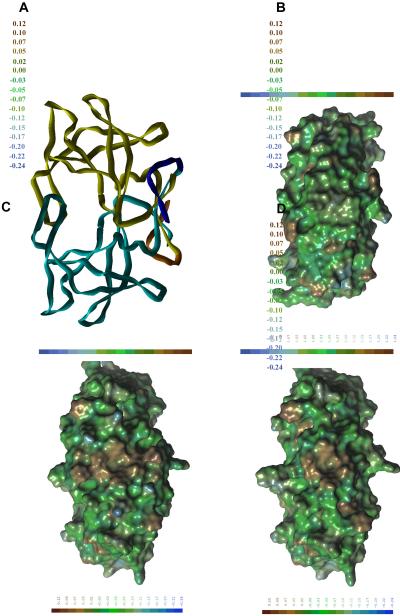
Figure 6. Structural representations of the HIV-1 and HTLV-1 proteases.
(A) Lipophilic potential of HIV-1 PR X-ray structure on Connolly-type molecular surface. (B) Lipophilic potential of HTLV-1 116 PR X-ray structure on Connolly-type molecular surface. (C) Ribbon representation of HTLV-1 125 PR. Residues 1–116 (X-ray structure) are shown in cyan (monomer A) and yellow (monomer B), while residues 117–125 (model) are shown in blue (monomer A) and orange (monomer B). The structure is shown in a view perpendicular to that of Figures A, B and D. (D) Lipophilic potential of HTLV-1 125 PR model on Connolly-type molecular surface.

