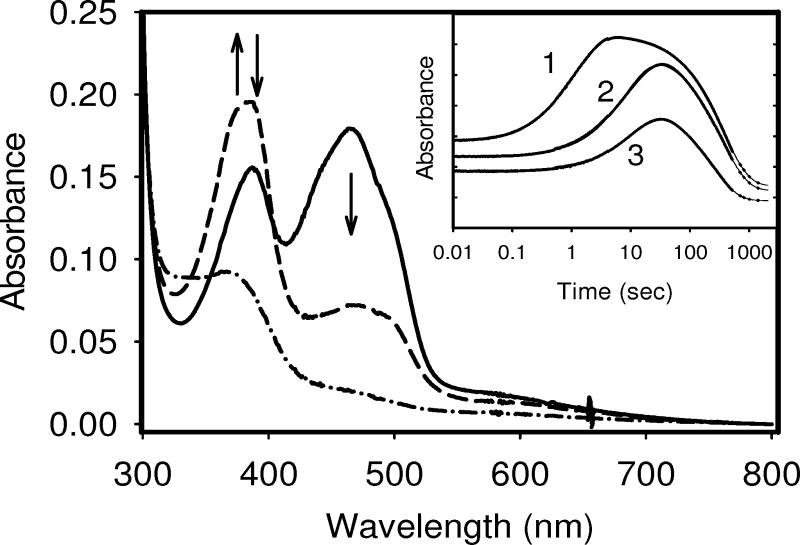
Figure 7.
Time courses for the reduction by excess sodium dithionite of the FMN-binding domains for the wild type, P540A, and P541A variants in a stopped-flow spectrophotometer in 100mM Tris HCl, pH 7.4 at 25 °C under anaerobic conditions. The main panel shows spectra recorded at the start (solid line: fully oxidized), during the reduction (at approximately 15 sec) (dashed line: anionic SQ formation), and the end of the experiment (dot-dashed line: fully reduced). Arrows indicate the direction of the absorbance changes. Inset: Time course (shown in log scale) for the reduction of each protein as recorded at 388 nm, which represents the wavelength maximum for the anionic form of the SQ. Solid lines are non-linear regression fits to two exponential functions. Absorbance scale for each time traces have been arbitrarily offset for clarity. Trace 1: P541A variant; Trace 2: wild type; Trace 3: P540A variant.

