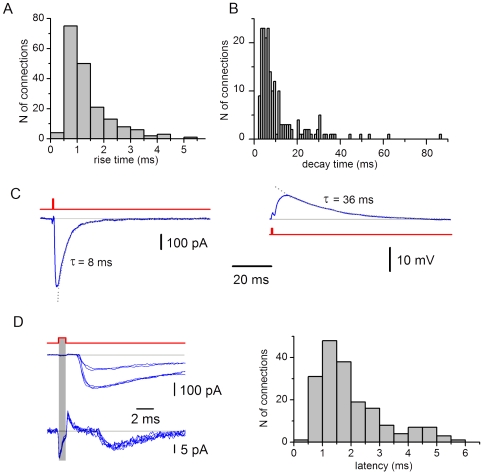
Figure 5. Time course and latency of monosynaptic EPSCs.
A, the distribution of the rise times from 10% to 80% of the EPSC amplitude (n = 183). The rise time was measured in averaged (15–30) traces. B, the distribution of the EPSC decay time constants (n = 194; 183 connections). In 11 connections, the decay was fitted with two exponentials. C, monosynaptic EPSC (−80 mV) and EPSP (−70 mV) elicited in the same neuron by stimulating an SG EIN. The decays are fitted with exponentials. D, the distribution of the latency times (n = 183). Latencies were measured as an interval between the end of the stimulation (grey bar) and the beginning of the EPSC measured at 10% of the amplitude. Recordings (each family of traces contains 5 EPSCs evoked by consecutive stimulations) are shown for two connections with different latencies.

