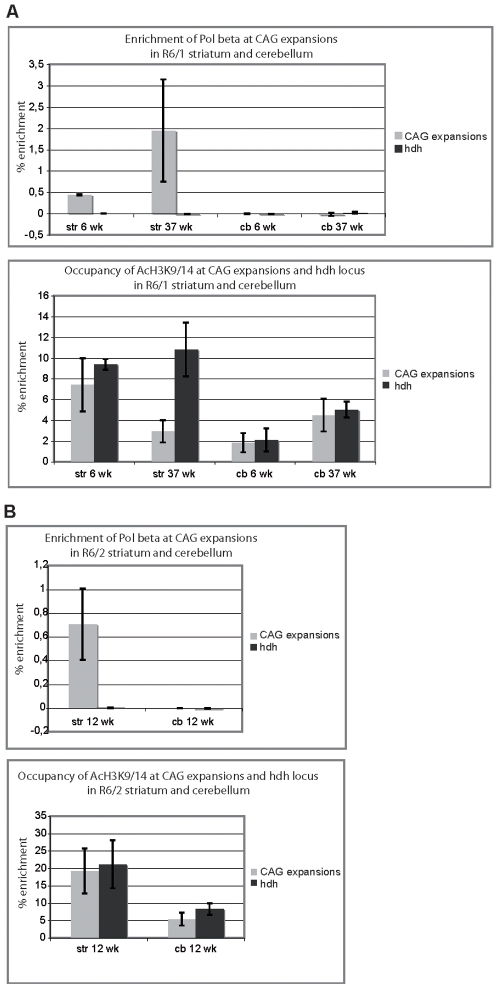
Figure 5. POLβ is specifically enriched at CAG expansions in the striatum but not in the cerebellum of HD mice.
ChIP of CAG-expanded and Hdh loci from striatum and cerebellum of R6/1 (A) and R6/2 (B) mice using α-POLβ antibody (upper panels) and as control, α-AcH3K9/14 antibody (lower panels). (A) R6/1 mice at both 6 and 37 weeks of age and R6/2 mice at 12 weeks of age were analyzed. Each ChIP experiment was performed by pooling striata and cerebella from 2 to 4 mice. The values plotted on the graphs represent the mean values obtained from 3 to 4 independent experiments. The values correspond to percentage of enrichment, calculated as follows: % enrichment = (relative DNA concentration after ChIP with POLβ or AcH3—relative DNA concentration after ChIP with no antibody)/input. Relative DNA concentrations were measured using quantitative PCR. Error bars are sem.

