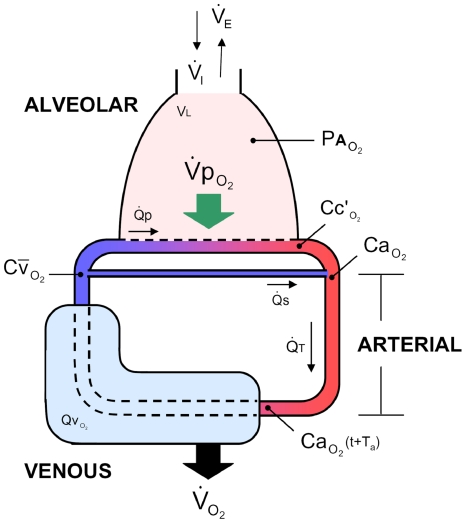
Figure 1. Model schematic representing O2 uptake, transport and consumption.
O2 stores are represented by the alveolar, arterial, and venous compartments. Two dynamically-independent levels of O2 uptake are denoted: pulmonary O2 uptake ( ) and metabolic consumption (
 ). R-L shunt is also included. Ta is the arterial transit time. Symbols are described in Table 1.

