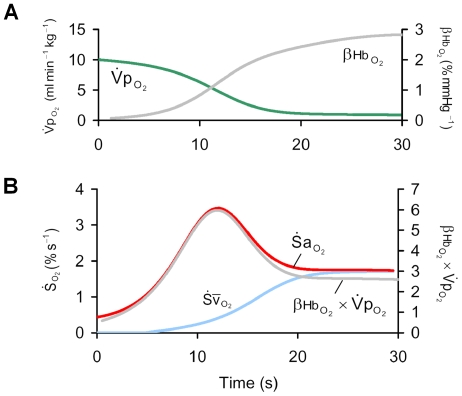
Figure 3. The time course of  during apnea.
Panel (A) shows the increase in the slope of the oxy-hemoglobin dissocation curve at the level of alveolar  (
( ), and the fall in pulmonary oxygen uptake (
 ) that occurs during apnea. Panel (B) shows that changes in the product
  explain the time course of the instantaneous slope of arterial O2 desaturation (
 ) during apnea. Note that the peak
  occurs when
  is substantially less than its resting value. Note also that the rate of fall of mixed-venous saturation (
 ) and
) and  become equal and constant after 20 s.

