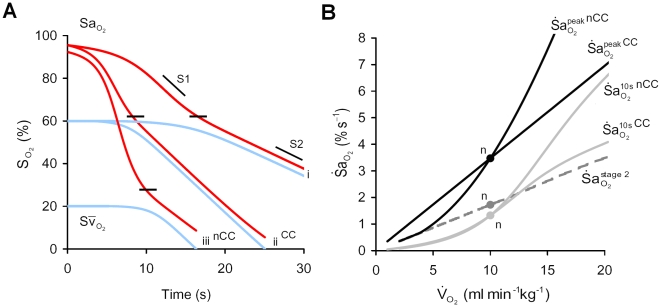
Figure 6. Impact of metabolic O2 consumption ( ) on
) on  .
.
Panel (A) shows the effect of doubling  on arterial (
 ) and mixed venous (
 ) O2 during apnea; (i) 10 ml min−1kg−1, (ii) 20 ml min−1kg−1 with cardiac compensation (CC), and (iii) 20 ml min−1kg−1 with no CC (nCC). Note that with CC, increased
  , from (i) to (ii), elevated
  uniformly at all levels of
  during both stages 1 and 2; note that the level of
  at the inflection point (shown by short black lines) is unchanged. With nCC (iii), increased
  caused a reduced resting
  and lower
  inflection, and greater
  during stage 1, compared to (ii). (B) Sensitivity of
  to changes in
  . Note that with increased
  : a uniform increase in
  occurred with CC, and a more-than-proportional increase was seen with nCC;
  is elevated in both cases, but more so with nCC; a uniform increase in
  is shown regardless of CC. n = ‘normal’ values; S1, stage 1 slope; S2, stage 2 slope.

