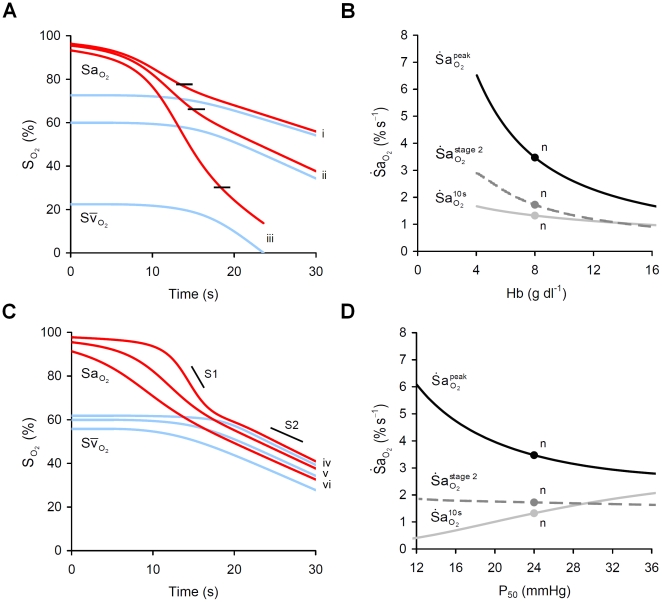
Figure 7. Impact of hemoglobin content (Hb) and O2 affinity (P50) on  .
.
(A) Effect of three levels of Hb, (i) 12 g dl−1, (ii) 8 g dl−1 and (iii) 4 g dl−1, on arterial ( ) and mixed venous (
 ) O2 desaturation during apnea. Note the fall in
  at the inflection point (shown by short black lines). Note also that the reduced Hb has little impact on desaturation above
  . (B) Sensitivity of
  to changes in Hb. (C) Effect of three levels of P50, (iv) 18 mmHg, (v) 24 mmHg, and (vi) 36 mmHg, on
  . (D) Sensitivity of
  to changes in P50. n = ‘normal’ values; S1, stage 1 slope; S2, stage 2 slope.

