Figure 8. Impact of cardiac output ( ) on
) on  .
.
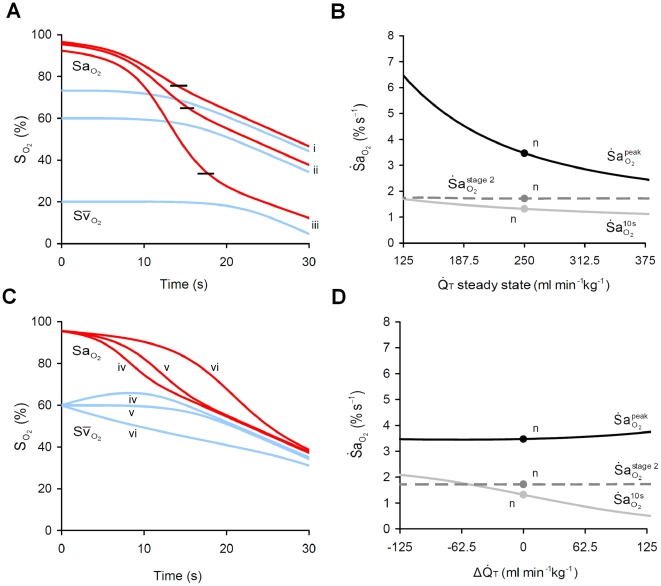
(A) Effect of three levels of resting  , (i) 375 ml min−1kg−1, (ii) 250 ml min−1kg−1, and (iii) 125 ml min−1kg−1, on arterial (
 ) and mixed venous (
 ) O2 during apnea. Note that reduced
  elevates
  , associated with a reduction in resting
  and reduction in
  at the stage 1–2 transition or inflection point (shown by short black lines). (B) Sensitivity of
  to changes in
  . Note the strong influence of
  on
on  , but negligible effect on
  and
and  . (C) Simulations in (A) repeated for a step change in
  at apnea onset by (iv) +125 ml min−1kg−1 (e.g. tachycardia), (v) 0 ml min−1kg−1, and (vi) −125 ml min−1kg−1 (e.g. bradycardia), following resting
  . Note that the transient effect of
  is opposite to the resting effect of
  on arterial desaturation during apnea. (D) Sensitivity of
  to acute changes in
  during apnea. Note the strong influence of a step-change in
  on
on  , but negligible effect on
  and
and  . n = ‘normal’ values.

