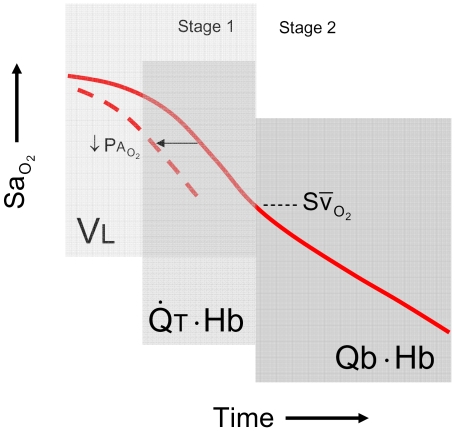
Figure 10. Conceptual framework depicting the temporal sequence of influence of the key cardiorespiratory factors on  .
.
Note the regions of influence of lung volume ( ), cardiac output (
 ) and blood volume (
 ), each with respect to metabolic O2 consumption (
 ). Hemoglobin content (Hb) influences the latter phase of stage 1 as well as stage 2. The impact of reduced
  is limited to stage 1, and blood volume to stage 2. Reduced
  causes a leftward shift in the desaturation trajectory. Note that the point of inflection at the transition between stages reveals the resting
  .
.

