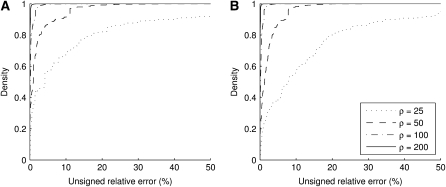
Figure 4.—
The effect of varying ρ (fixing c = 20). Plotted is the cumulative distribution of the unsigned relative error of  across all dimorphic sample configurations of size c = 20 for ρ = 200 (solid line), ρ = 100 (dotted-dashed line), ρ = 50 (dashed line), and ρ = 25 (dotted line). (a) θ = 0.01. (b) θ = 1.

