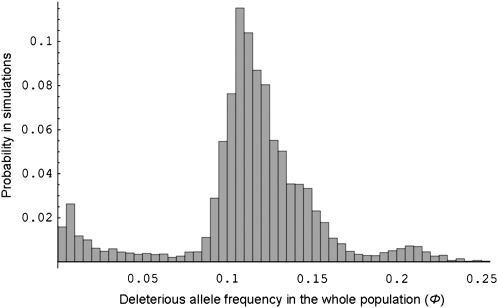
Figure 1.—
Frequency distribution of the deleterious mutation in the whole population (Φ) with complete recessivity of the deleterious mutation (h = 0). The histogram shows the proportion of the 10,000 samples from simulations (y-axis) where the deleterious mutation is encountered with a given frequency (x-axis). Five S alleles and three dominance classes were assumed, with two alleles in the most dominant and the intermediate classes and one allele in the most recessive class. Other parameters values: μ = 10−4, η = 10−5, N = 1000, and s = 0.1.

