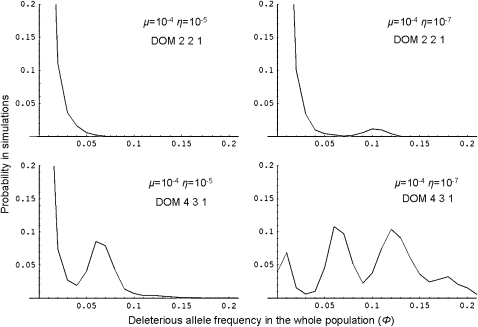
Figure 3.—
Frequency distribution of the deleterious mutation in the whole population with partial recessivity (h = 0.2). Top: Five S alleles and three dominance classes as in Figure 1. Bottom: Eight S alleles and three dominance classes with respectively four, three, and one alleles in the dominant, intermediate, and recessive classes. The mutation rates were μ = 10−4 and η = 10−5 and μ = 10−4 and η = 10−7, for left and right histograms, respectively. Other parameters values: N = 1000, s = 0.1.

