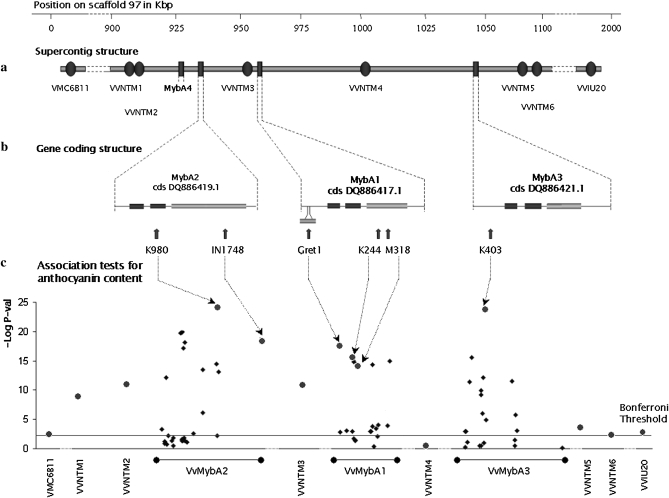
Figure 2.—
(a) Presentation of VvMybA gene cluster and SSR markers, (b) position of the QTNs, and (c) level of association between markers and total anthocyanin content of berry skin along scaffold 97 of the grape genome browser. Along the x-axes, the dashed lines correspond to nonlinear scales. In the association tests, the microsatellite markers are presented in red, and the genic polymorphisms in blue; for the genic polymorphisms, dots correspond to QTNs and diamonds to the other polymorphisms. The Bonferonni threshold is equal to 6.25E-4.

