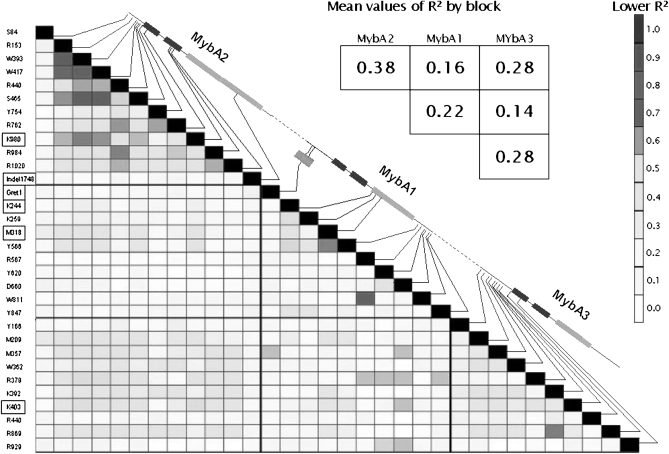
Figure 3.—
LD plot based on R2 values for the SNPs and indels associated with the total anthocyanin content of berry skin on VvMybA1, -A2, and -A3 genes in the lower diagonal and overall level of LD for the full genes in the upper diagonal. QTNs selected through stepwise cofactor selection (far left column) are framed in black. Presented R2 values are estimated according to Remington et al. (2001).

