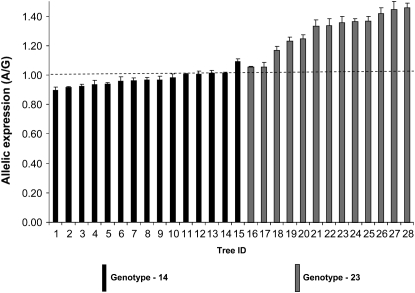
Figure 7.—
Allelic expression imbalance in the E. nitens full-sib family. Allelic expression was measured using cDNA from 28 trees heterozygous for SNP7. Heterozygous trees are made up of two different genotypic classes. Error bars are standard error of mean. Mean value is based on four replicates. Dashed line indicates average allelic expression of gDNA controls. Allelic expression of genotype class 2, 3 is significantly higher (P < 0.0001) than that of gDNA controls, using Kruskal–Wallis analysis with Dunn's post-test.

