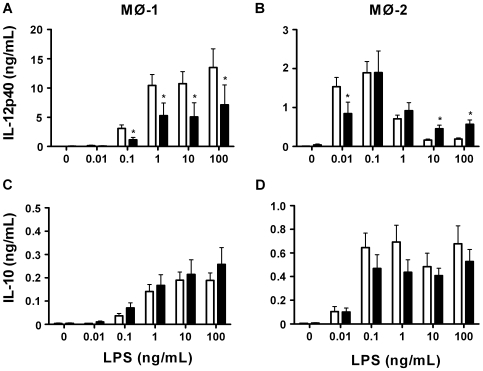
Figure 2. Cytokine production in response to LPS.
We measured the production of IL-12p40 (A,B) and IL-10 (C,D) by control and secretions-differentiated MØ-1 and MØ-2 in response to a range of LPS. The results, expressed in ng/ml, are means±SEM of 9–10 experiments. Open bars: control macrophages; filled bars: secretions differentiated macrophages. *p<0.05 for differences from control macrophages.

