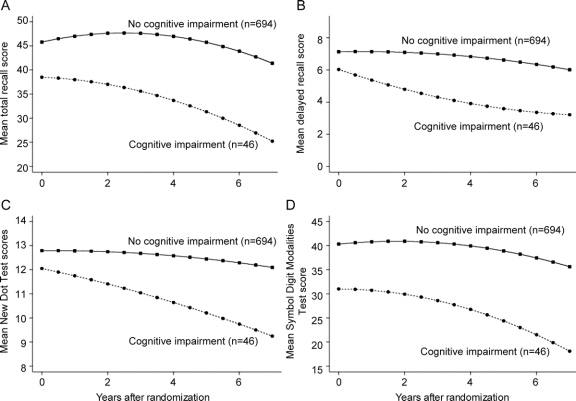
Figure 2 Evolution of cognitive test performances over time
The plotted values are adjusted group means derived from a mixed-effects regression model that included linear and quadratic terms for time. Subjects who eventually developed cognitive impairment (n = 46) had worse performance at baseline than those who did not develop cognitive impairment (n = 694) (p < 0.003 for all tests) and also had greater decline over time on both verbal and nonverbal tests (p < 0.01 for Selective Reminding Test and New Dot Task; p < 0.05 for Symbol Digit Modalities Test).

