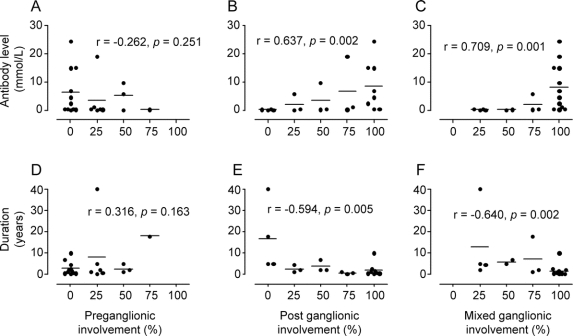
Figure 2 Increased ganglionic antibody levels but not disease duration results in greater postganglionic sudomotor dysfunction
Higher ganglionic α3 nAChR antibody levels results in progressive postganglionic (B) and mixed ganglionic (C) patterns of sudomotor dysfunction. Conversely, there was no correlation with preganglionic sudomotor dysfunction (A). Preganglionic (D), postganglionic (E), and mixed ganglionic (F) sudomotor dysfunction did not correlate with disease duration. The Y axis indicates antibody levels (nmol/L; A–C) and disease duration (years; D–F). The X axis indicates the percentage of QSART sites (i.e., forearm, proximal leg, distal leg, foot) involved. For example, if all 4 sites were involved for a particular pattern (preganglionic, postganglionic, or mixed ganglionic), this would be equivalent to 100% on the X axis. Each point on the graph represents a single patient. The corresponding lines are equal to the mean ganglionic α3 nAChR antibody level (A–C) or duration in years (D–F).

