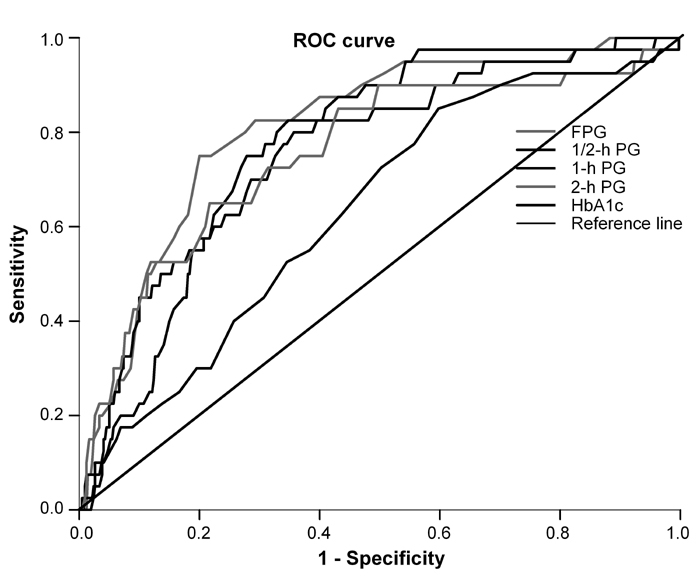
Figure 1.

Receiver operating characteristic (ROC) curves for fasting, 1/2-hour, 1-hour and 2-hour glucose and HbA1c for prediction of type 2 diabetes in non-diabetic first-degree relatives of patients with type 2 diabetes. The estimated area under the ROC curves and their 95% confidence intervals are shown in Table 3.
